Showing posts with label my presentations. Show all posts

Saturday, April 06, 2013

Digital Divide Decoded @ IIT Kharagpur - A Movie

#this video is created as a solution for movie assignment for IT & Business Applications Lab, Spring Semester, VGSoM, IIT Kharagpur Class of 2014


Few video links of assignments of batchmates in which I appear are as follows:
1. http://goo.gl/K7NZj 
2. http://bit.ly/140He0i
3. http://goo.gl/ykdkQ 
4. http://bit.ly/17k0k0f


Tuesday, February 26, 2013

ITBA lab Session # 7 - 26 Feb 2013

#this post is created as a solution for assignment for IT & Business Applications Lab, Spring Semester, VGSoM, IIT Kharagpur Class of 2014.

Problem

Solution


Thursday, February 14, 2013

ITBA lab Session # 6 - 12 Feb 2013

#this post is created as a solution for assignment for IT & Business Applications Lab, Spring Semester, VGSoM, IIT Kharagpur Class of 2014.

The data used is NSE Nifty data from 1st January 2012 to 31st January 2013

1. Create log of the returns data,  Use log returns and calculate the historical  volatility
2. Create ACF Plot for log returns and do the ADF test and analyse on it


Commands used are as follows with their explanations


The LOG values in the value z are as follows

Plot of Log returns


ACF Plot


Analysis : From the graph it is clear that most of  the standard errors are with in the confidence interval of 95%.Hence time series can be considered stationary.

Historical Value calculation


Augmented Dicky filler test


Analysis: Since p value is .01, (less than .05) null hypothesis can be rejected.Hence time series is stationary and data analysis can be done.


Tuesday, February 05, 2013

ITBA lab Session # 5 - 05 Feb 2013

#this post is created as a solution for assignment for IT & Business Applications Lab, Spring Semester, VGSoM, IIT Kharagpur Class of 2014.


Assignment 1

1. Find returns of NSE data of greater than 6 months having selected the 10th data point as start and 95th data point as end.

2. Find plot of that return

The file consist of S&P CNX Nifty data from January 2012 to July 2012.

Code


Extra Commands


Returns


Plot


Assignment 2

1-700 data is available, Predict the data from 701-850, use the GLM estimation using LOGIT Analysis for the same.

Solution:


Annexures:


Tuesday, January 29, 2013

ITBA lab Session # 4 - 29 Jan 2013

#this post is created as a solution for assignment for IT & Business Applications Lab, Spring Semester, VGSoM, IIT Kharagpur Class of 2014.

Assignment: EXCEL MACROS
: Read multiple CSV files
: Create multiple charts
: Each chart should show
-multiple company
-different parameters


Tuesday, January 15, 2013

ITBA lab Session # 2 - 15 Jan 2013

#this post is created as a solution for assignment for IT & Business Applications Lab, Spring Semester, VGSoM, IIT Kharagpur Class of 2014.

Assignment # 1
a. Create two matrix.
b. Select highlighted columns.
c. Use cbind to join and create a new matrix.

Assignment # 2
Create two matrices and multiply them

Assignment # 3
Download 30 days Nifty data from 1 Dec 2012 to 31 Dec 2012 and then perform regression on that.

Data downloaded:


Computed Result

Assignment # 4
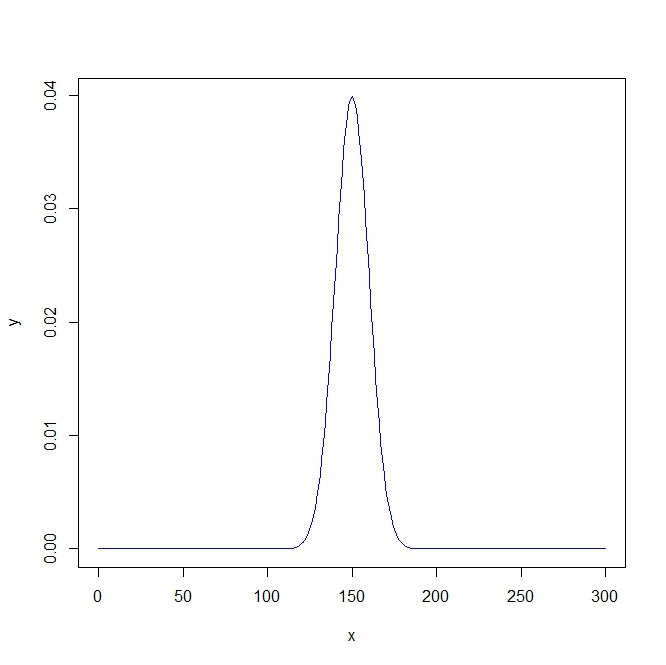
Generate and plot a Normal distribution


Tuesday, January 08, 2013

ITBA lab Session # 1 - 8 Jan 2013

#this post is created as a solution for assignment for IT & Business Applications Lab, Spring Semester, VGSoM, IIT Kharagpur Class of 2014.

0) Create line plot of x


1) Plot ZCol1 as histogram from NSE data extracted


2) Plot both lines and points along with labels for X-axis, Y-axis and graph name 


3) Create a scatter plot by selecting low values


4) Draw a graph showing volatility in the data


Wednesday, November 28, 2012

Tata Steel Ideation Contest

# This post is created as requirement for MIS Course,Autumn Semester,VGSoM Batch of 2014, which will serve as a dual role of entry to the Tata Steel Ideation Contest and Assignment # 4 for the course

#This assignment was solved jointly by Happy Garg (12BM60103) and Shehzad Karkhanawala (12BM60065)

Objective:

Tata Steel is looking for an original idea that will use any aspect of digital technology (cloud, mobile, Android, IoS etc ) to create a application or platform that can be integrated with the strategic management requirements of the company. Since this is an ideation contest, no software need to be built but paper must contain the following sections.

  1. Identify a need or a gap in the current management architecture of Tata Steel. Information available in the public domain can be used for this purpose.
  2. Propose a solution that will show how the current gap can be closed or narrowed significantly
  3. If possible give examples where a similar solution has or is being implemented.
  4. List benefits -- economic or otherwise -- that will accrue to the company if it is implemented. Also identify potential problems or difficulties that need to be guarded against.
  5. Provide  rough estimate of costs including people costs that the company would have to incur as a one time expense and as a regular expense.

The Solution which was required to be submitted as a presentation is as below:


Wednesday, September 19, 2012

TeCh GyMkHaNA - (Vendor side perspective)

#disclaimer: This post is prepared as a requirement for ZOHO APP, MIS Course, VGSoM, IIT Kharagpur fall semester class of 2014

Topic: Develop an application in Zoho Creator
An Order to Cash application that will allow a sales rep to register an order, a delivery person to record a delivery, a finance person to create an invoice and to record a payment in cash or cheque. Specifications are left fuzzy and it is expected that student will use his knowledge of business to come out with an appropriate design.

This application was created by me on request of my customer for the completion of ZOHO app assignment.

Customer : Kamya Sharma (12BM60101)
Vendor: Happy Garg (12BM60103)

Click here for USER MANUAL
Click here for CUSTOMER CERTIFICATE

Online Form powered by

Tuesday, August 14, 2012

Wonders of the Brain

This presentation is my work on the magnificence of human brain or more specifically how left brain and right brain co-ordinate our functions and play a larger role in defining our personality,find out which careers would be suited for you depending on weather you are a left or a right brain person.

It was compiled from various sources in February 2009 as a part of the module, Getting comfortable with visual aids, as a requirement for the Competent Communicator award  from the prestigious Toastmasters International, USA.

Go Through this presentation and indulge in all the games/activities listed in this presentation.
Certain animations in this presentation might not work on the web so download it from slideshare and play it on power point.


Hope you enjoyed it, kindly post your valuable queries/comments. :)