#this post is created as a solution for assignment for IT & Business Applications Lab, Spring Semester, VGSoM, IIT Kharagpur Class of 2014.
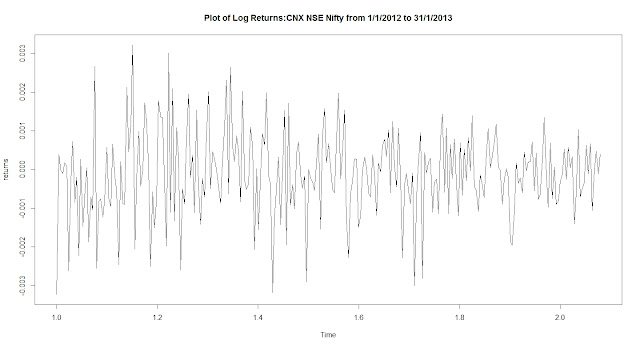
The data used is NSE Nifty data from 1st January 2012 to 31st January 2013
1. Create log of the returns data, Use log returns and calculate the historical volatility
2. Create ACF Plot for log returns and do the ADF test and analyse on it
Commands used are as follows with their explanations

The LOG values in the value z are as follows
Plot of Log returns
ACF Plot

Analysis : From the graph it is clear that most of the standard errors are with in the confidence interval of 95%.Hence time series can be considered stationary.
Historical Value calculation

Augmented Dicky filler test

Analysis: Since p value is .01, (less than .05) null hypothesis can be rejected.Hence time series is stationary and data analysis can be done.
The data used is NSE Nifty data from 1st January 2012 to 31st January 2013
1. Create log of the returns data, Use log returns and calculate the historical volatility
2. Create ACF Plot for log returns and do the ADF test and analyse on it
Commands used are as follows with their explanations

The LOG values in the value z are as follows

Plot of Log returns

ACF Plot

Analysis : From the graph it is clear that most of the standard errors are with in the confidence interval of 95%.Hence time series can be considered stationary.
Historical Value calculation

Augmented Dicky filler test

Analysis: Since p value is .01, (less than .05) null hypothesis can be rejected.Hence time series is stationary and data analysis can be done.
No comments:
Post a Comment
Please leave your precious comment here...